Data design
ROle: Art direction/Data visualization & Analysis | agency: Kantar | Client: various
Various presentations and infographics put together using only PowerPoint and a library of icons to inform various clients of how their brand/product was received among a survey of individuals. The information that is presented was pulled and calculated across various team members, where I then used my knowledge obtained through several weeks of training to learn pull and configure the data, to then be routed to the off-shore Quality Assurance teams in India.
Summary of Trial and Awareness among the Trident Gum brand
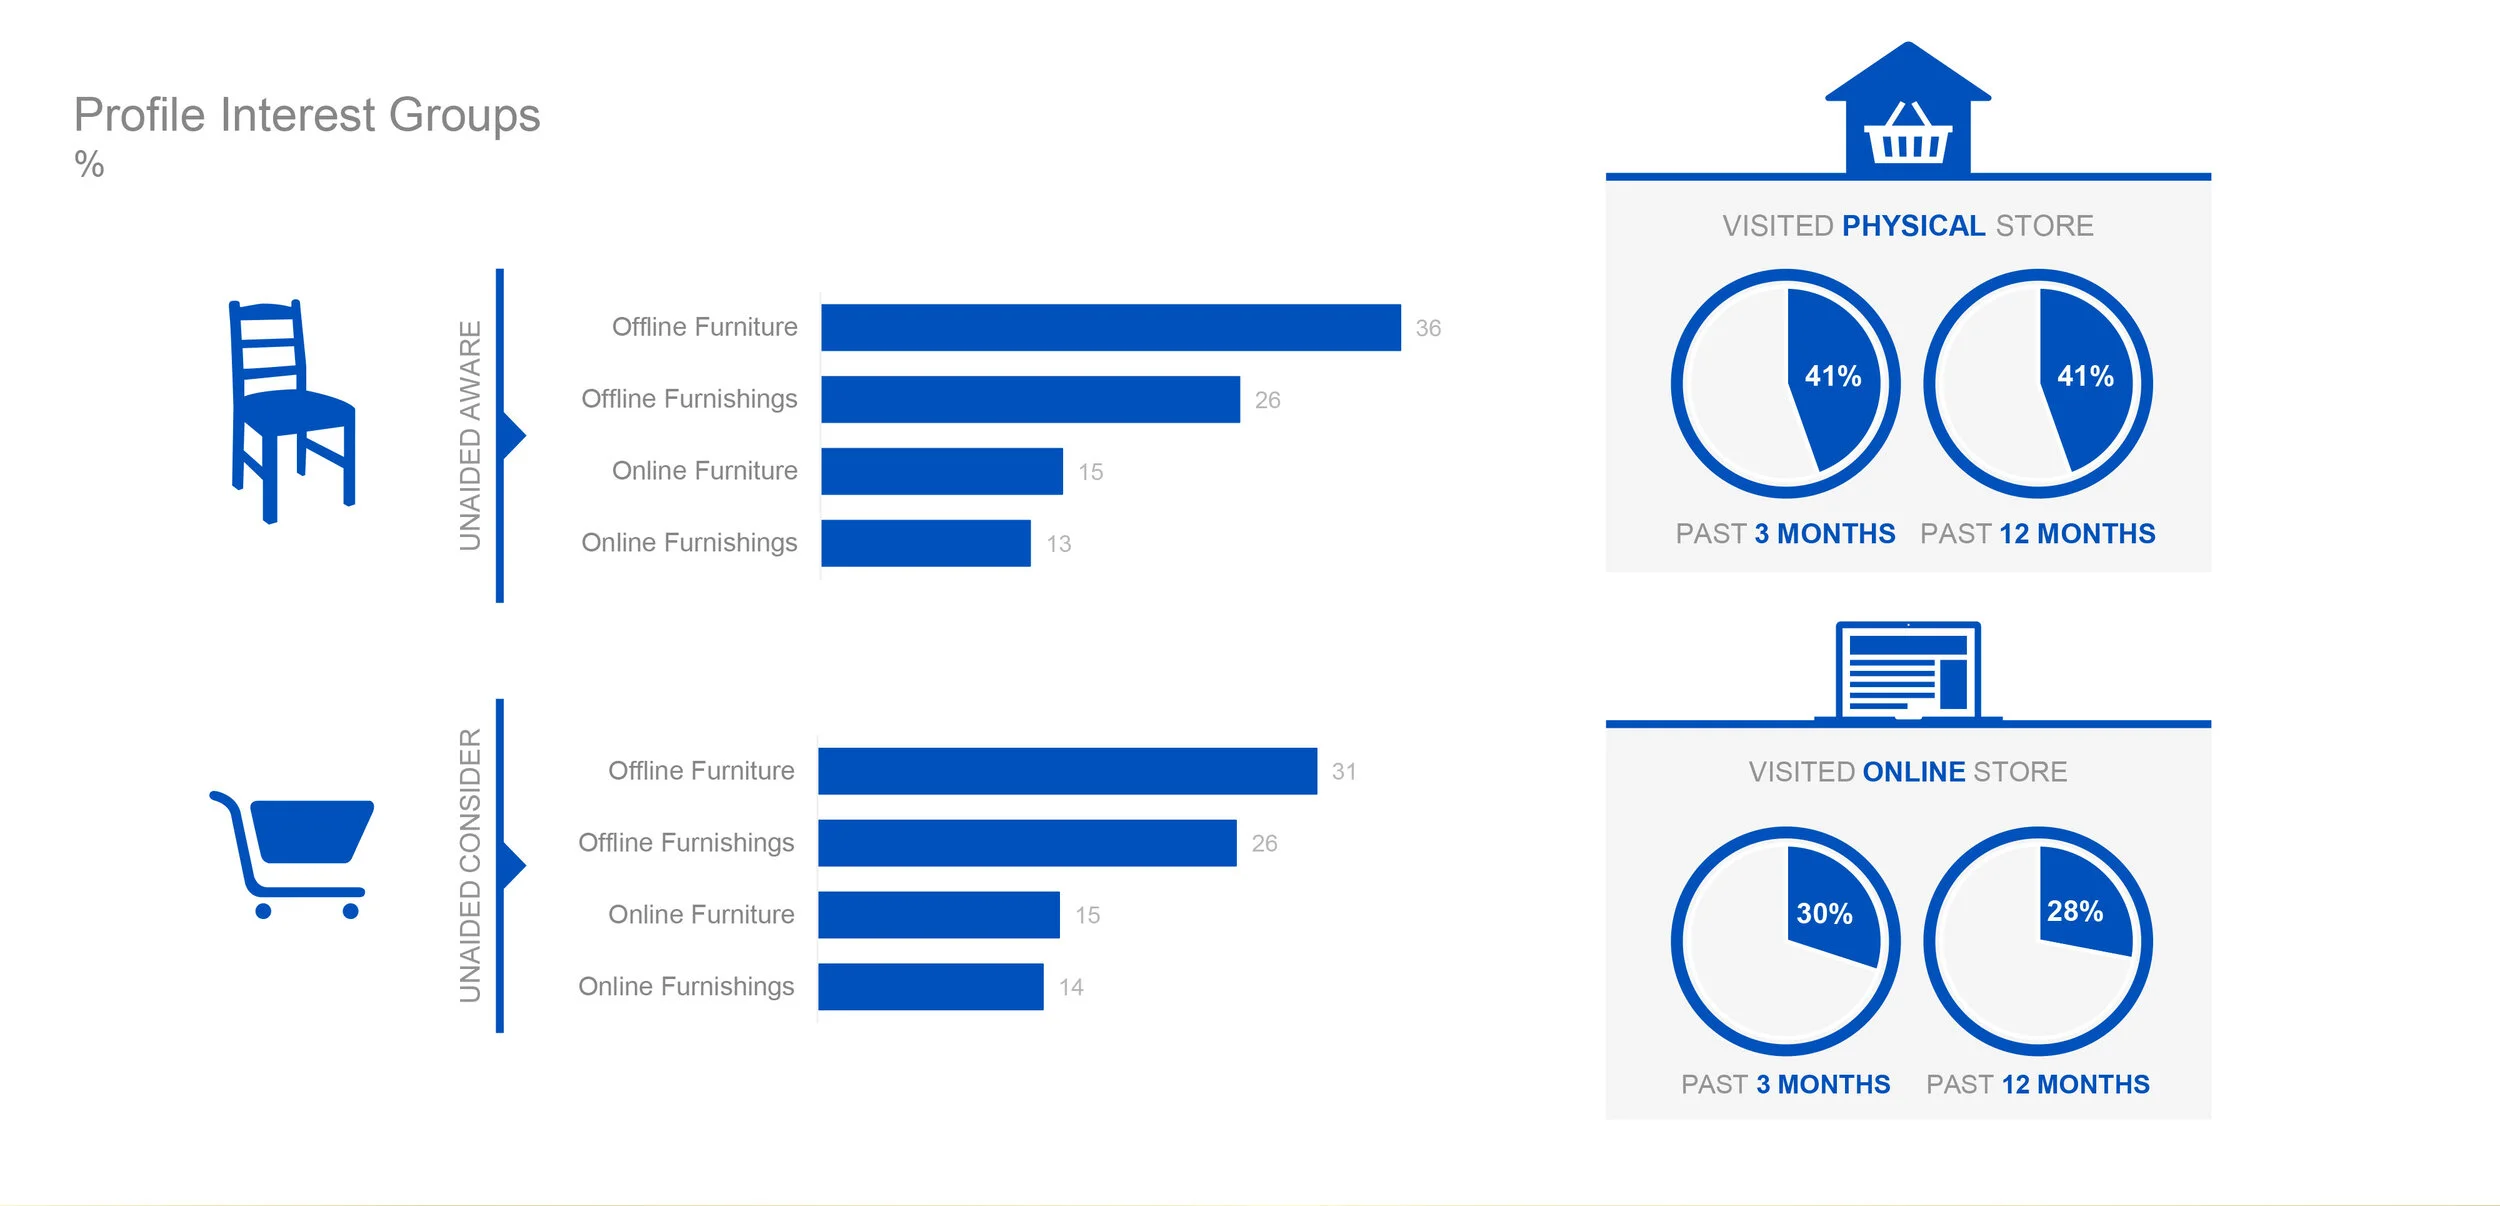
Profile Interest of IKEA customers
Data pulled across gender, age groups, and level of income, while also showing the aided and unaided percentages of those who frequented the website as opposed to in-store visits.
Summary of data—Original vs. designed
This example shows the vast range of how data was presented to me originally, and how I influenced and designed the data that was visual in a way where the client and off-shore team could easily read and decipher. Through various ways of organizing and color-coding the data and verbiage, I created several different layouts of the slide to be presented to the cilent.

Option 1
Option 2
Option 3
Option 4
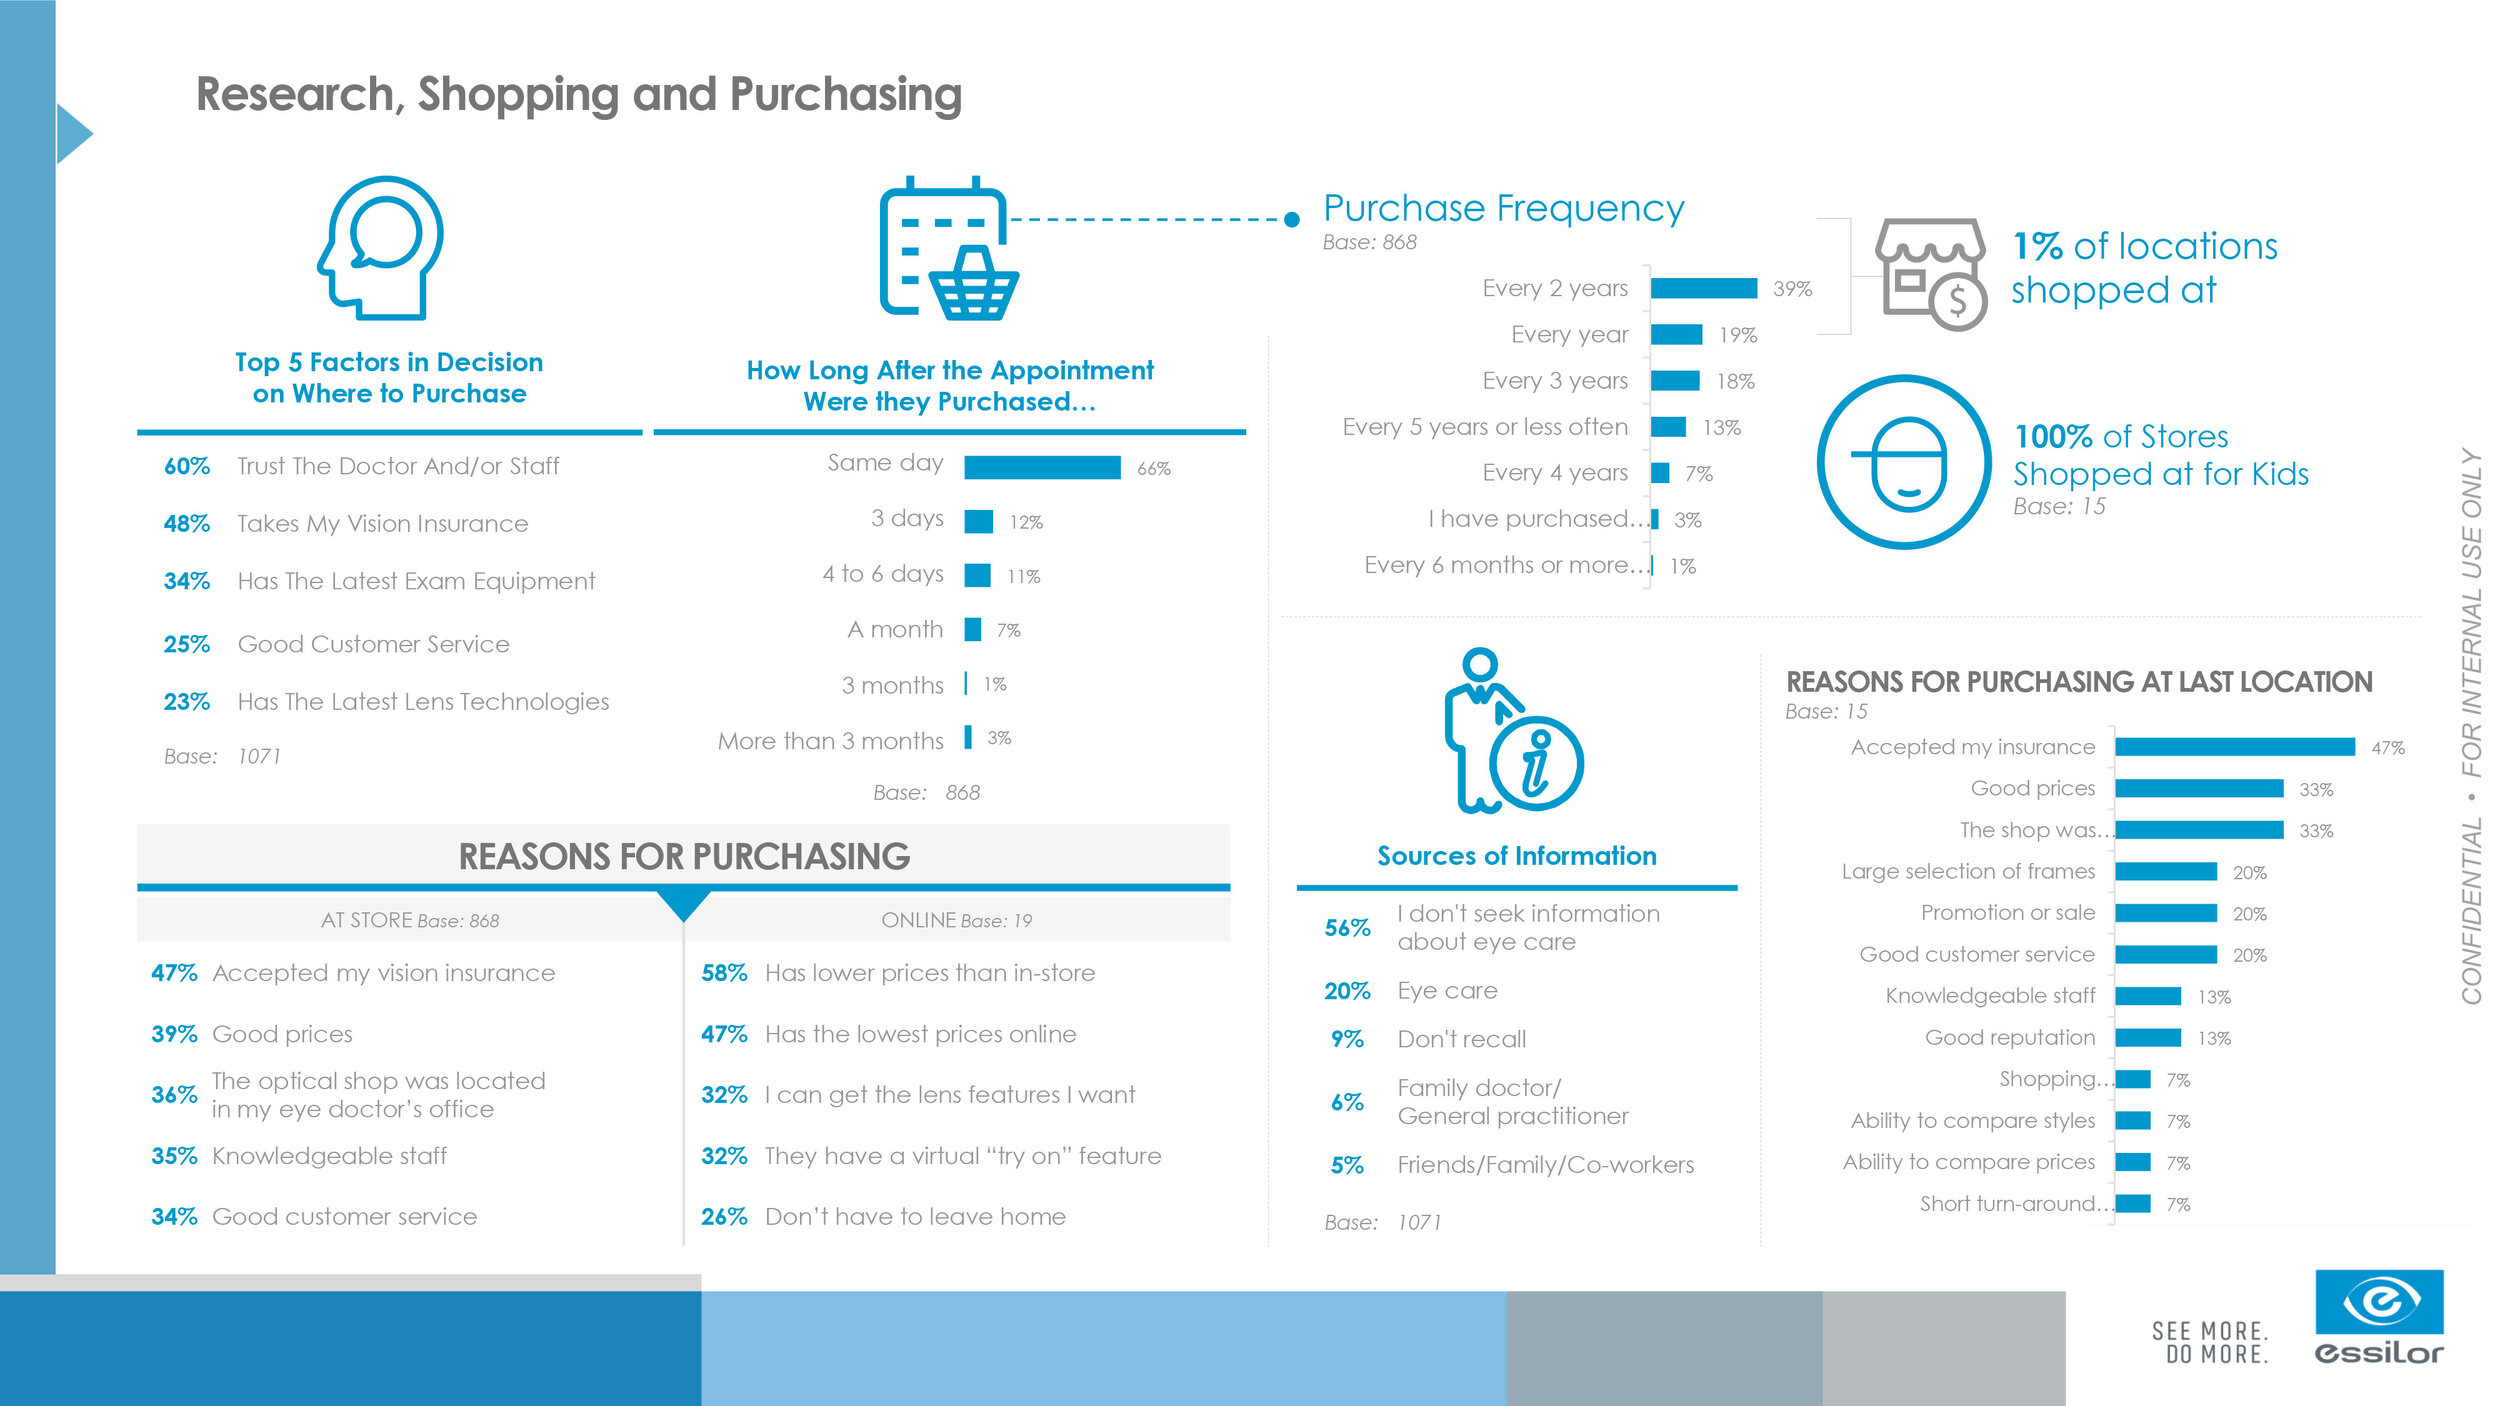
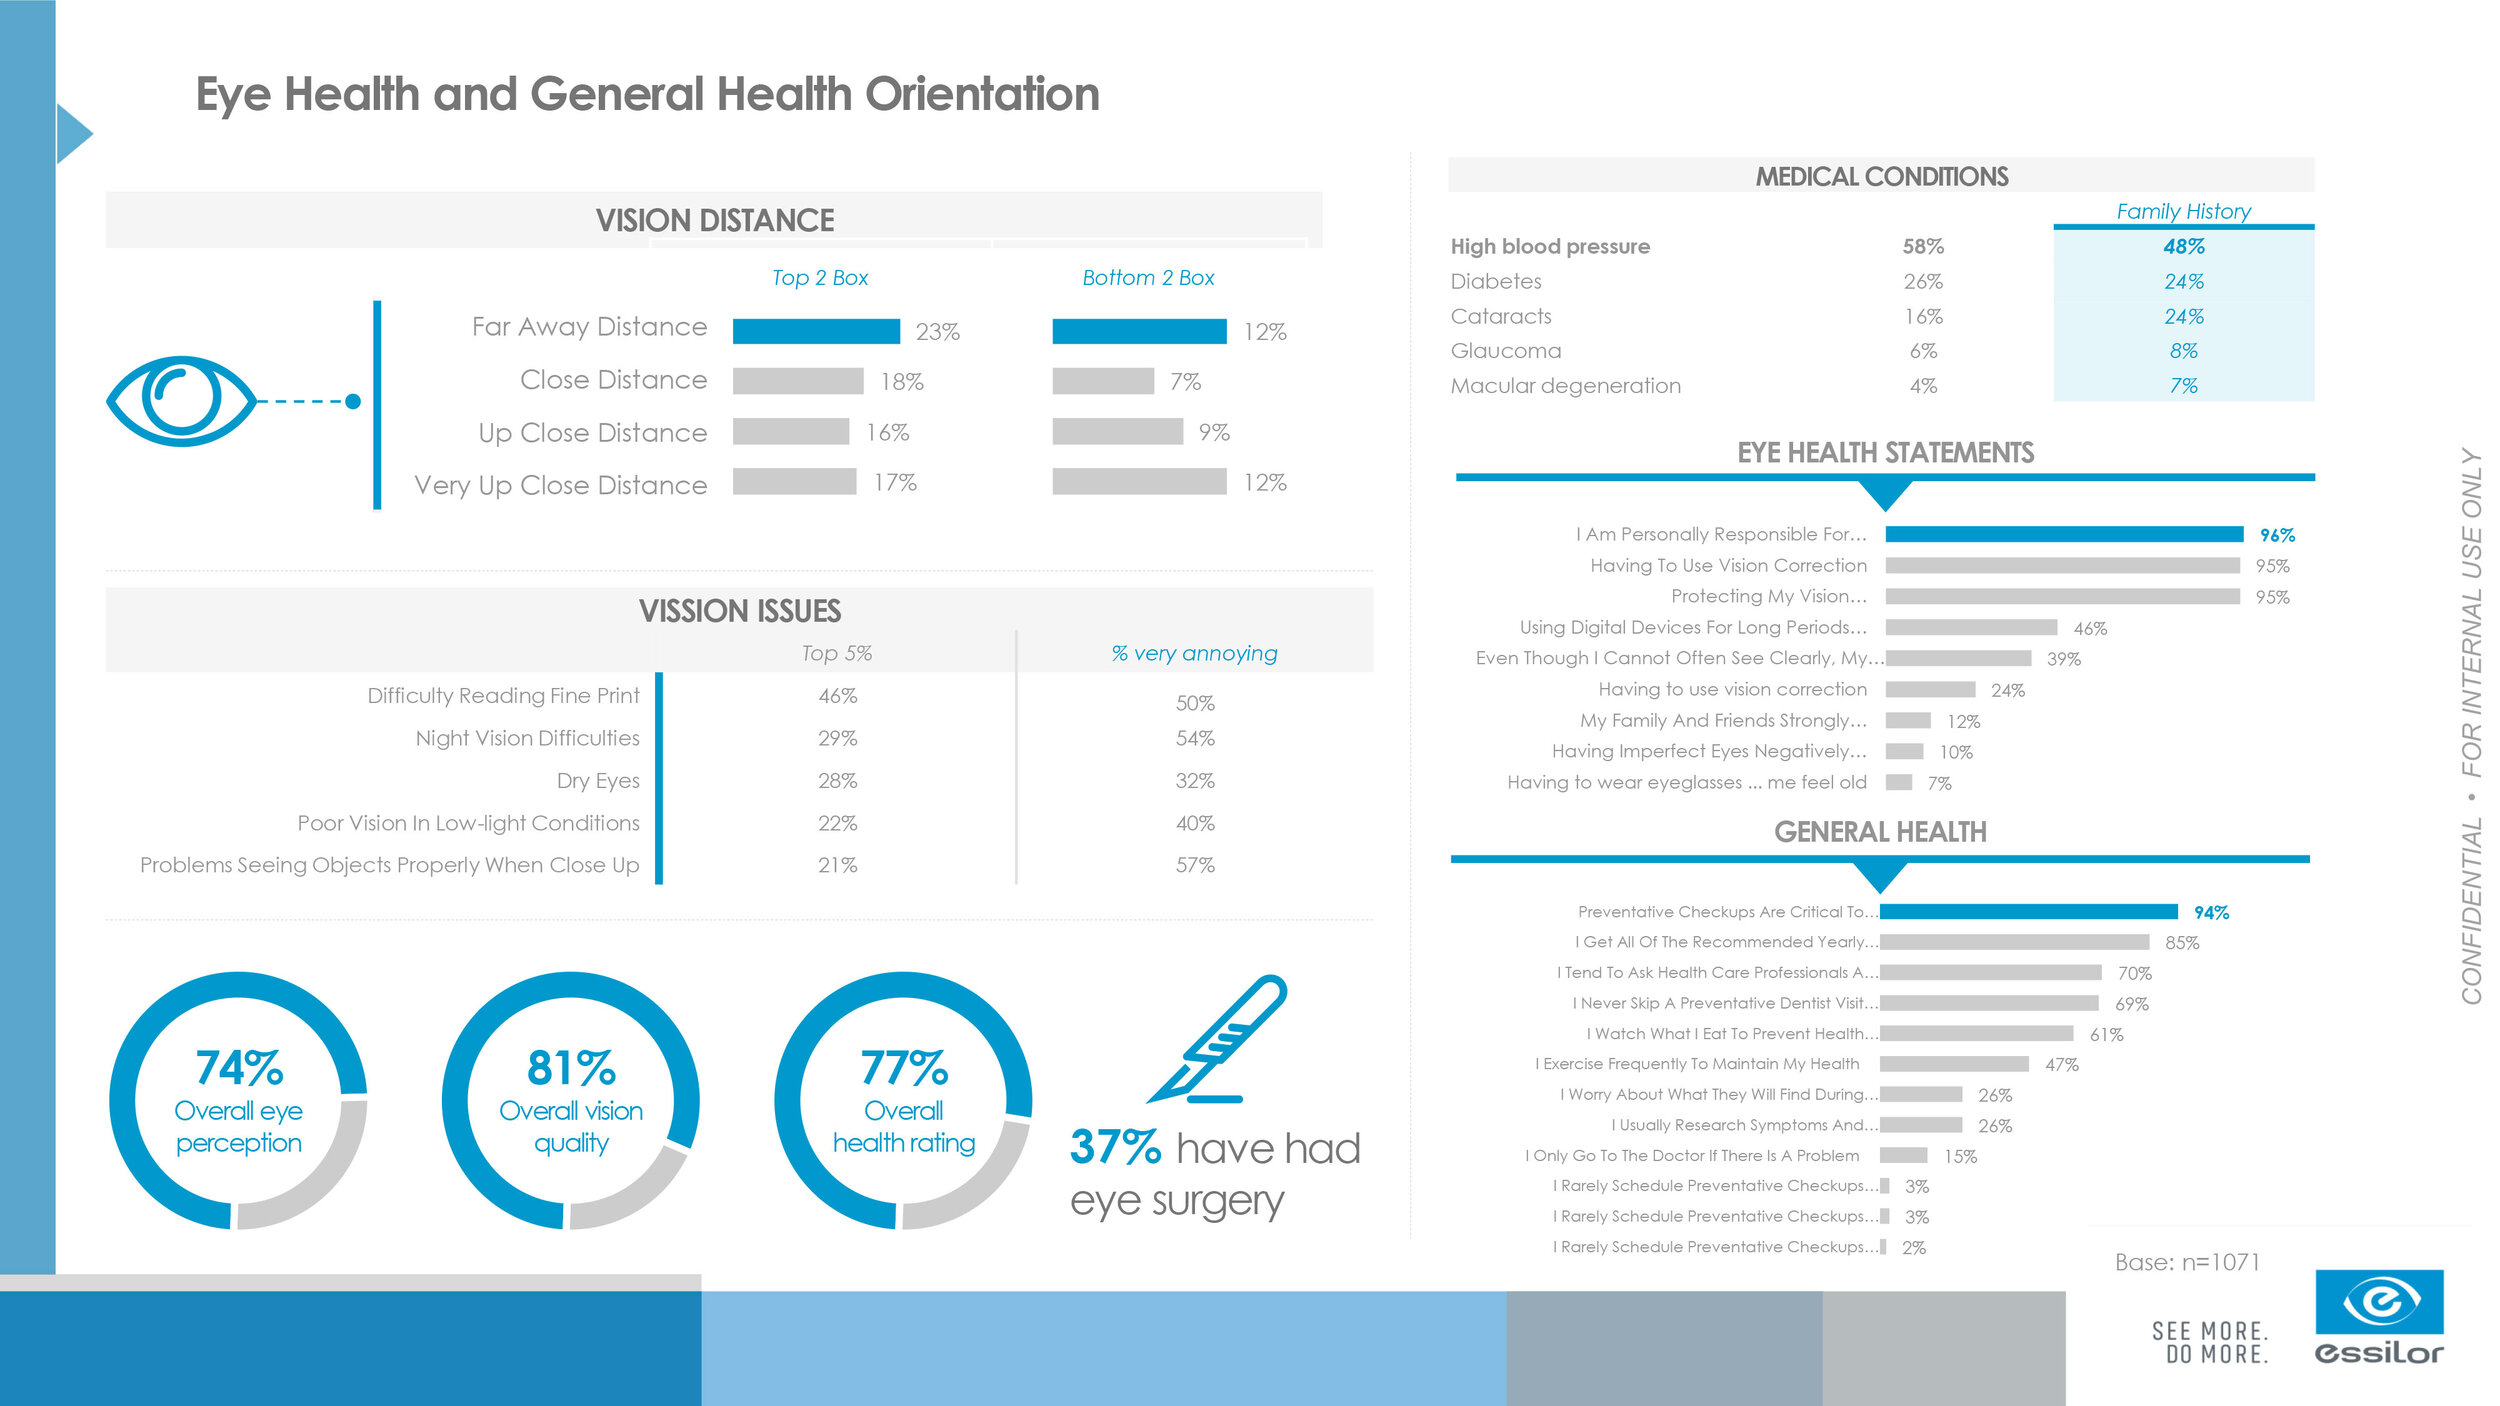
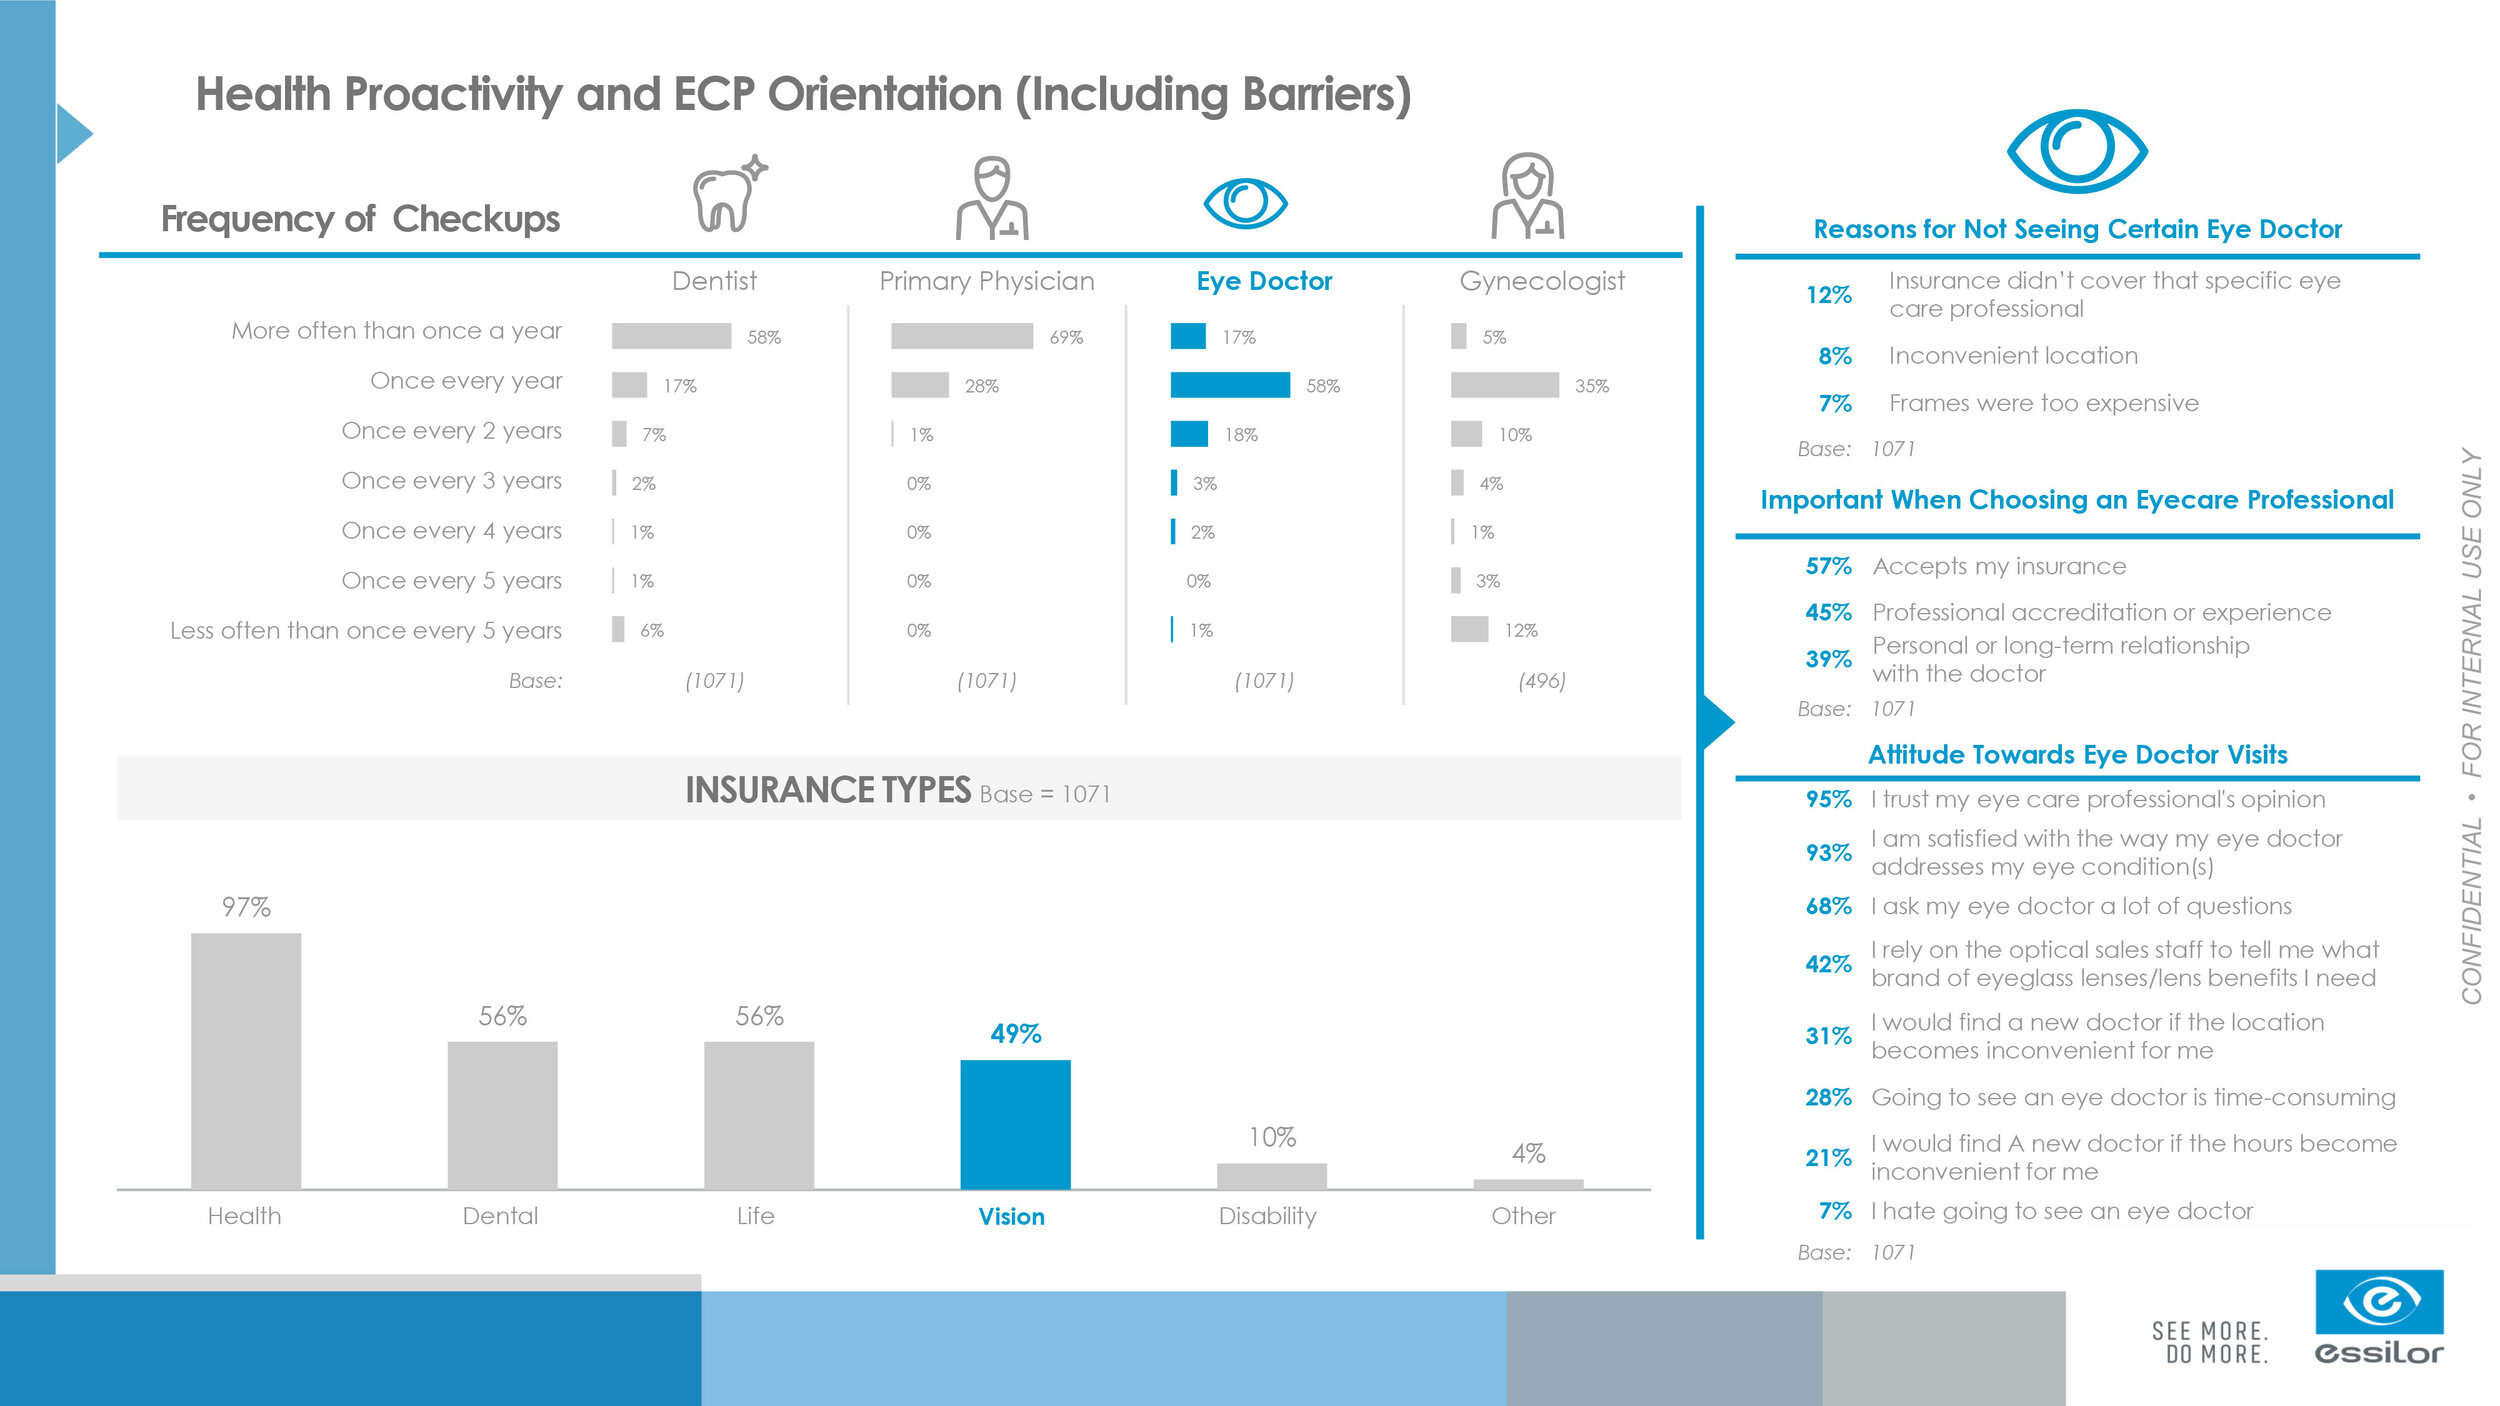
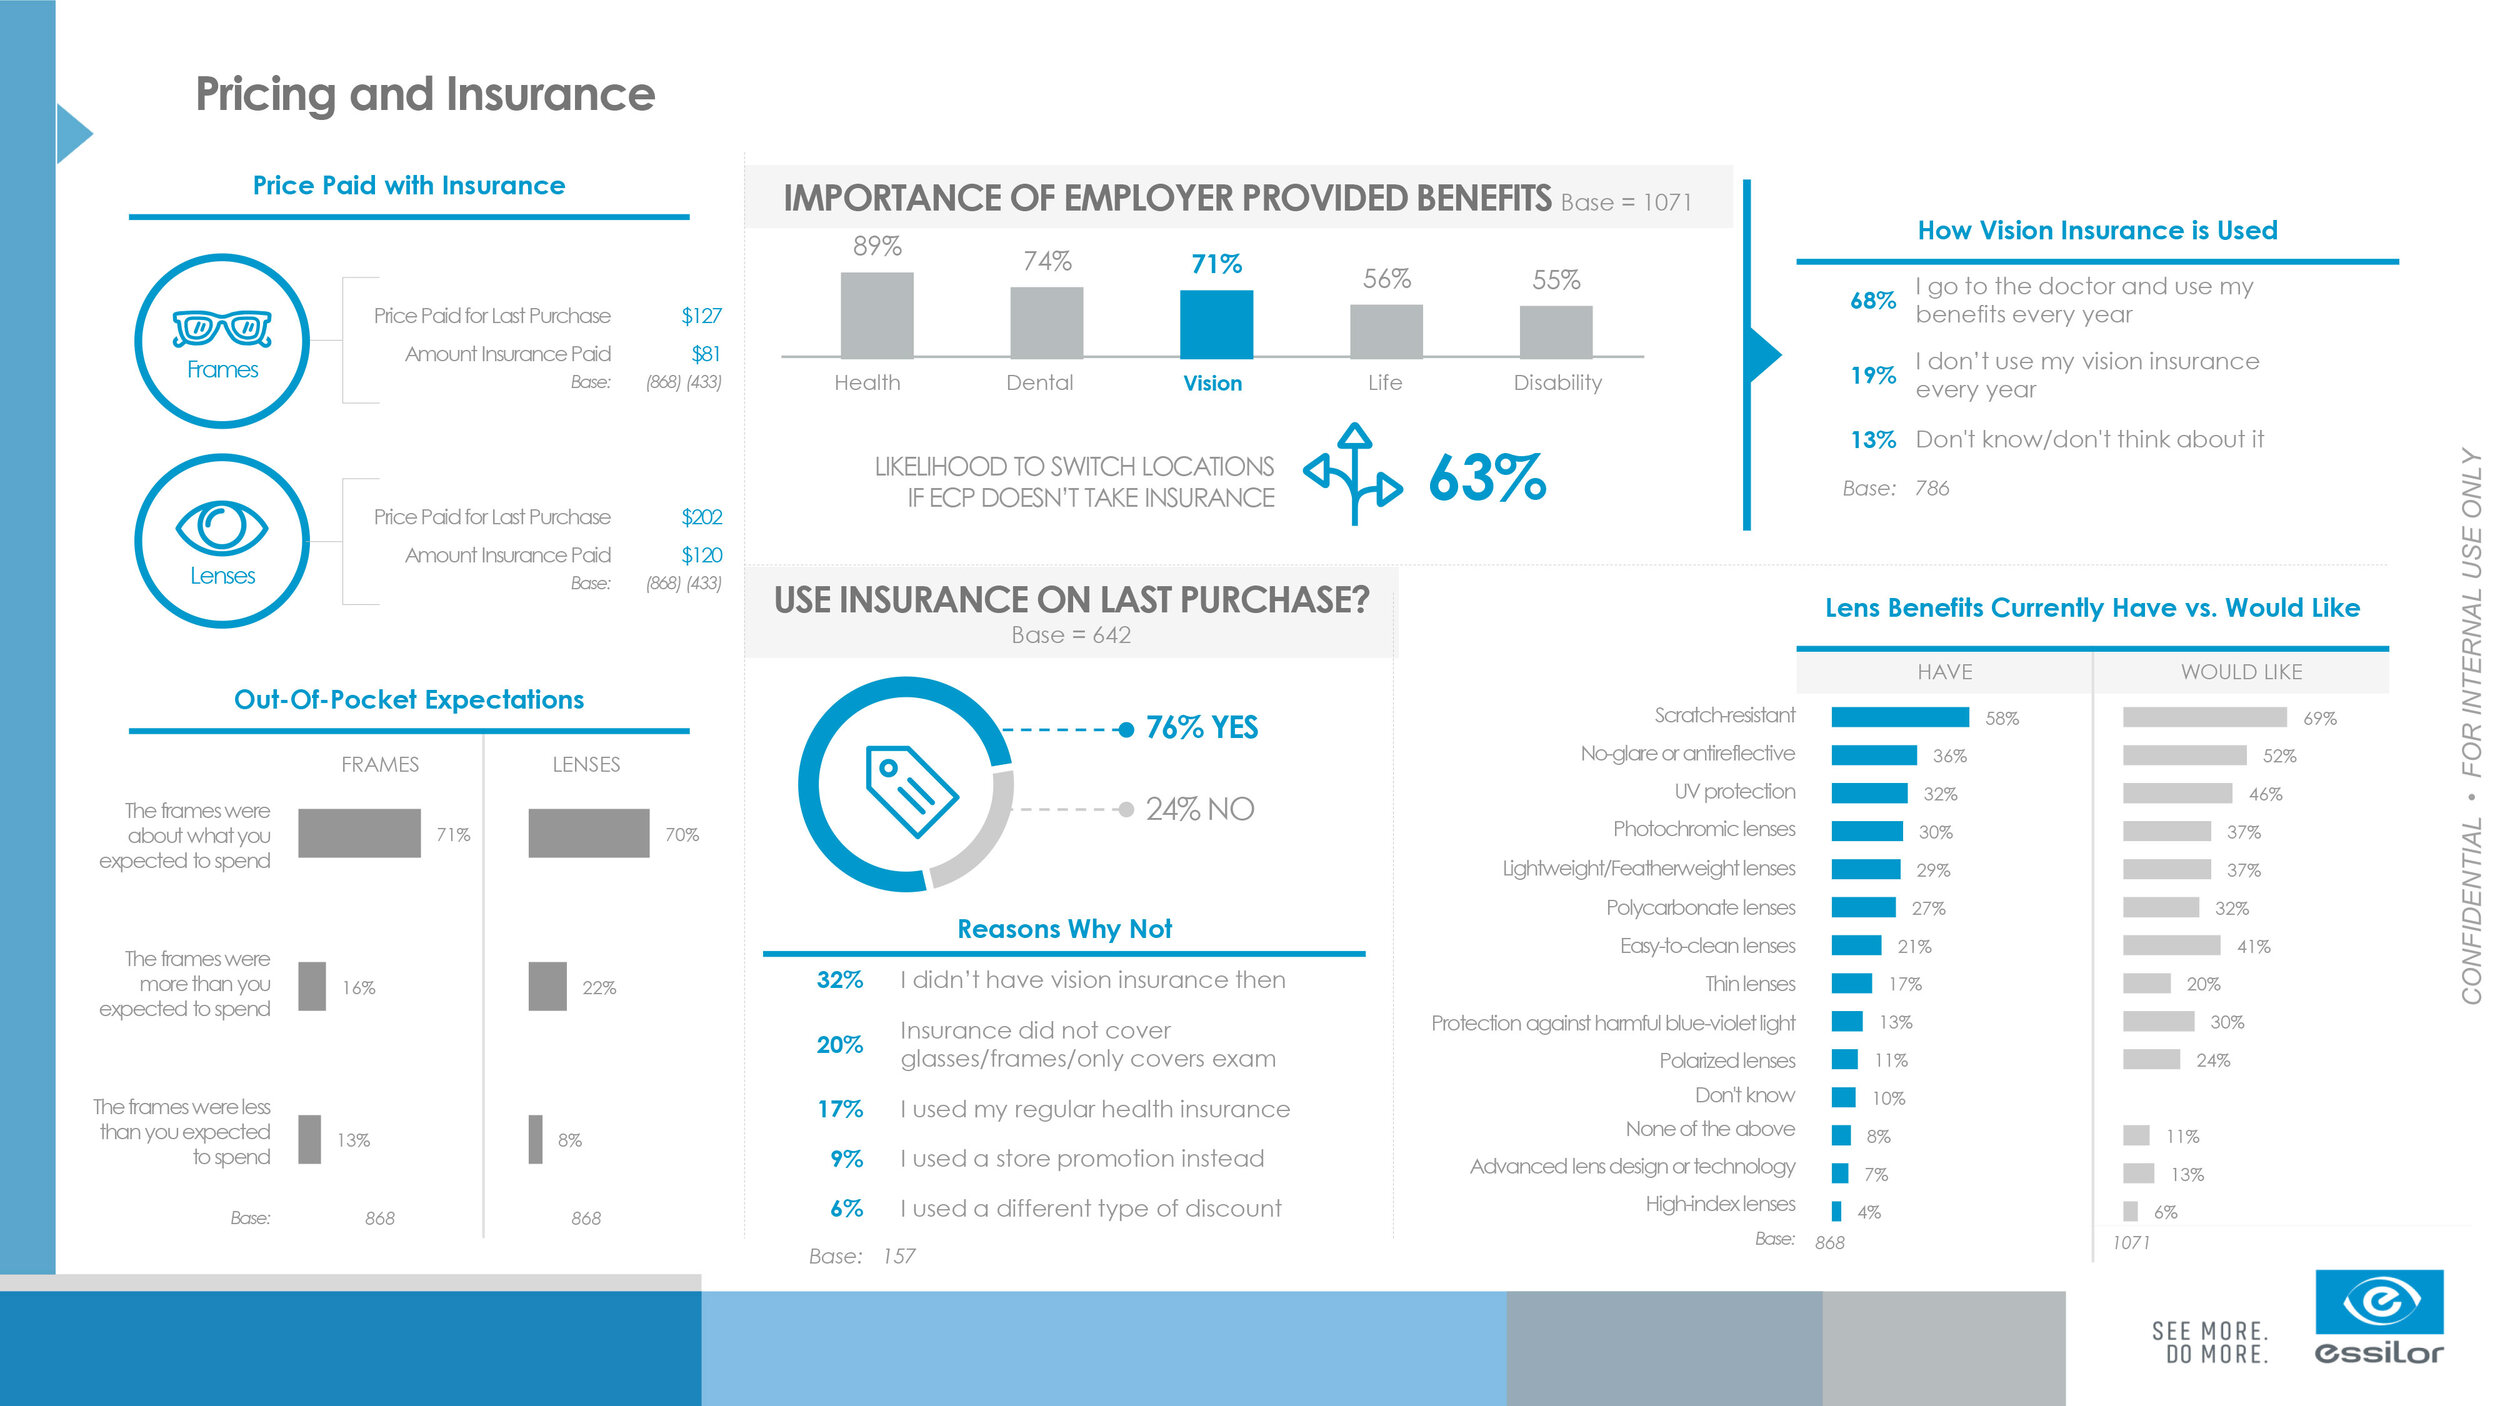
Consumer Segmentation for Vision Care
This project spanned over the course of several months with various batches of data coming in through Excel that needed to be pulled, calculated and routed to the off-shore teams all within a matter of weeks. Designed from scratch, without using a pre-existing template, these slides proved to be time consuming and high-priority on both the design side and the quality assurance side, but we all worked together and cooperated with each other to get the job done efficiently and correctly.
Below are several examples of just a few of the multi-paged document, showcasing various types of categories that data was surveyed and pulled for.